
Chart display and colours
Change how the chart, its lines and your marks look.
What you'll do: make the chart easier to read in the way that suits you.
Steps
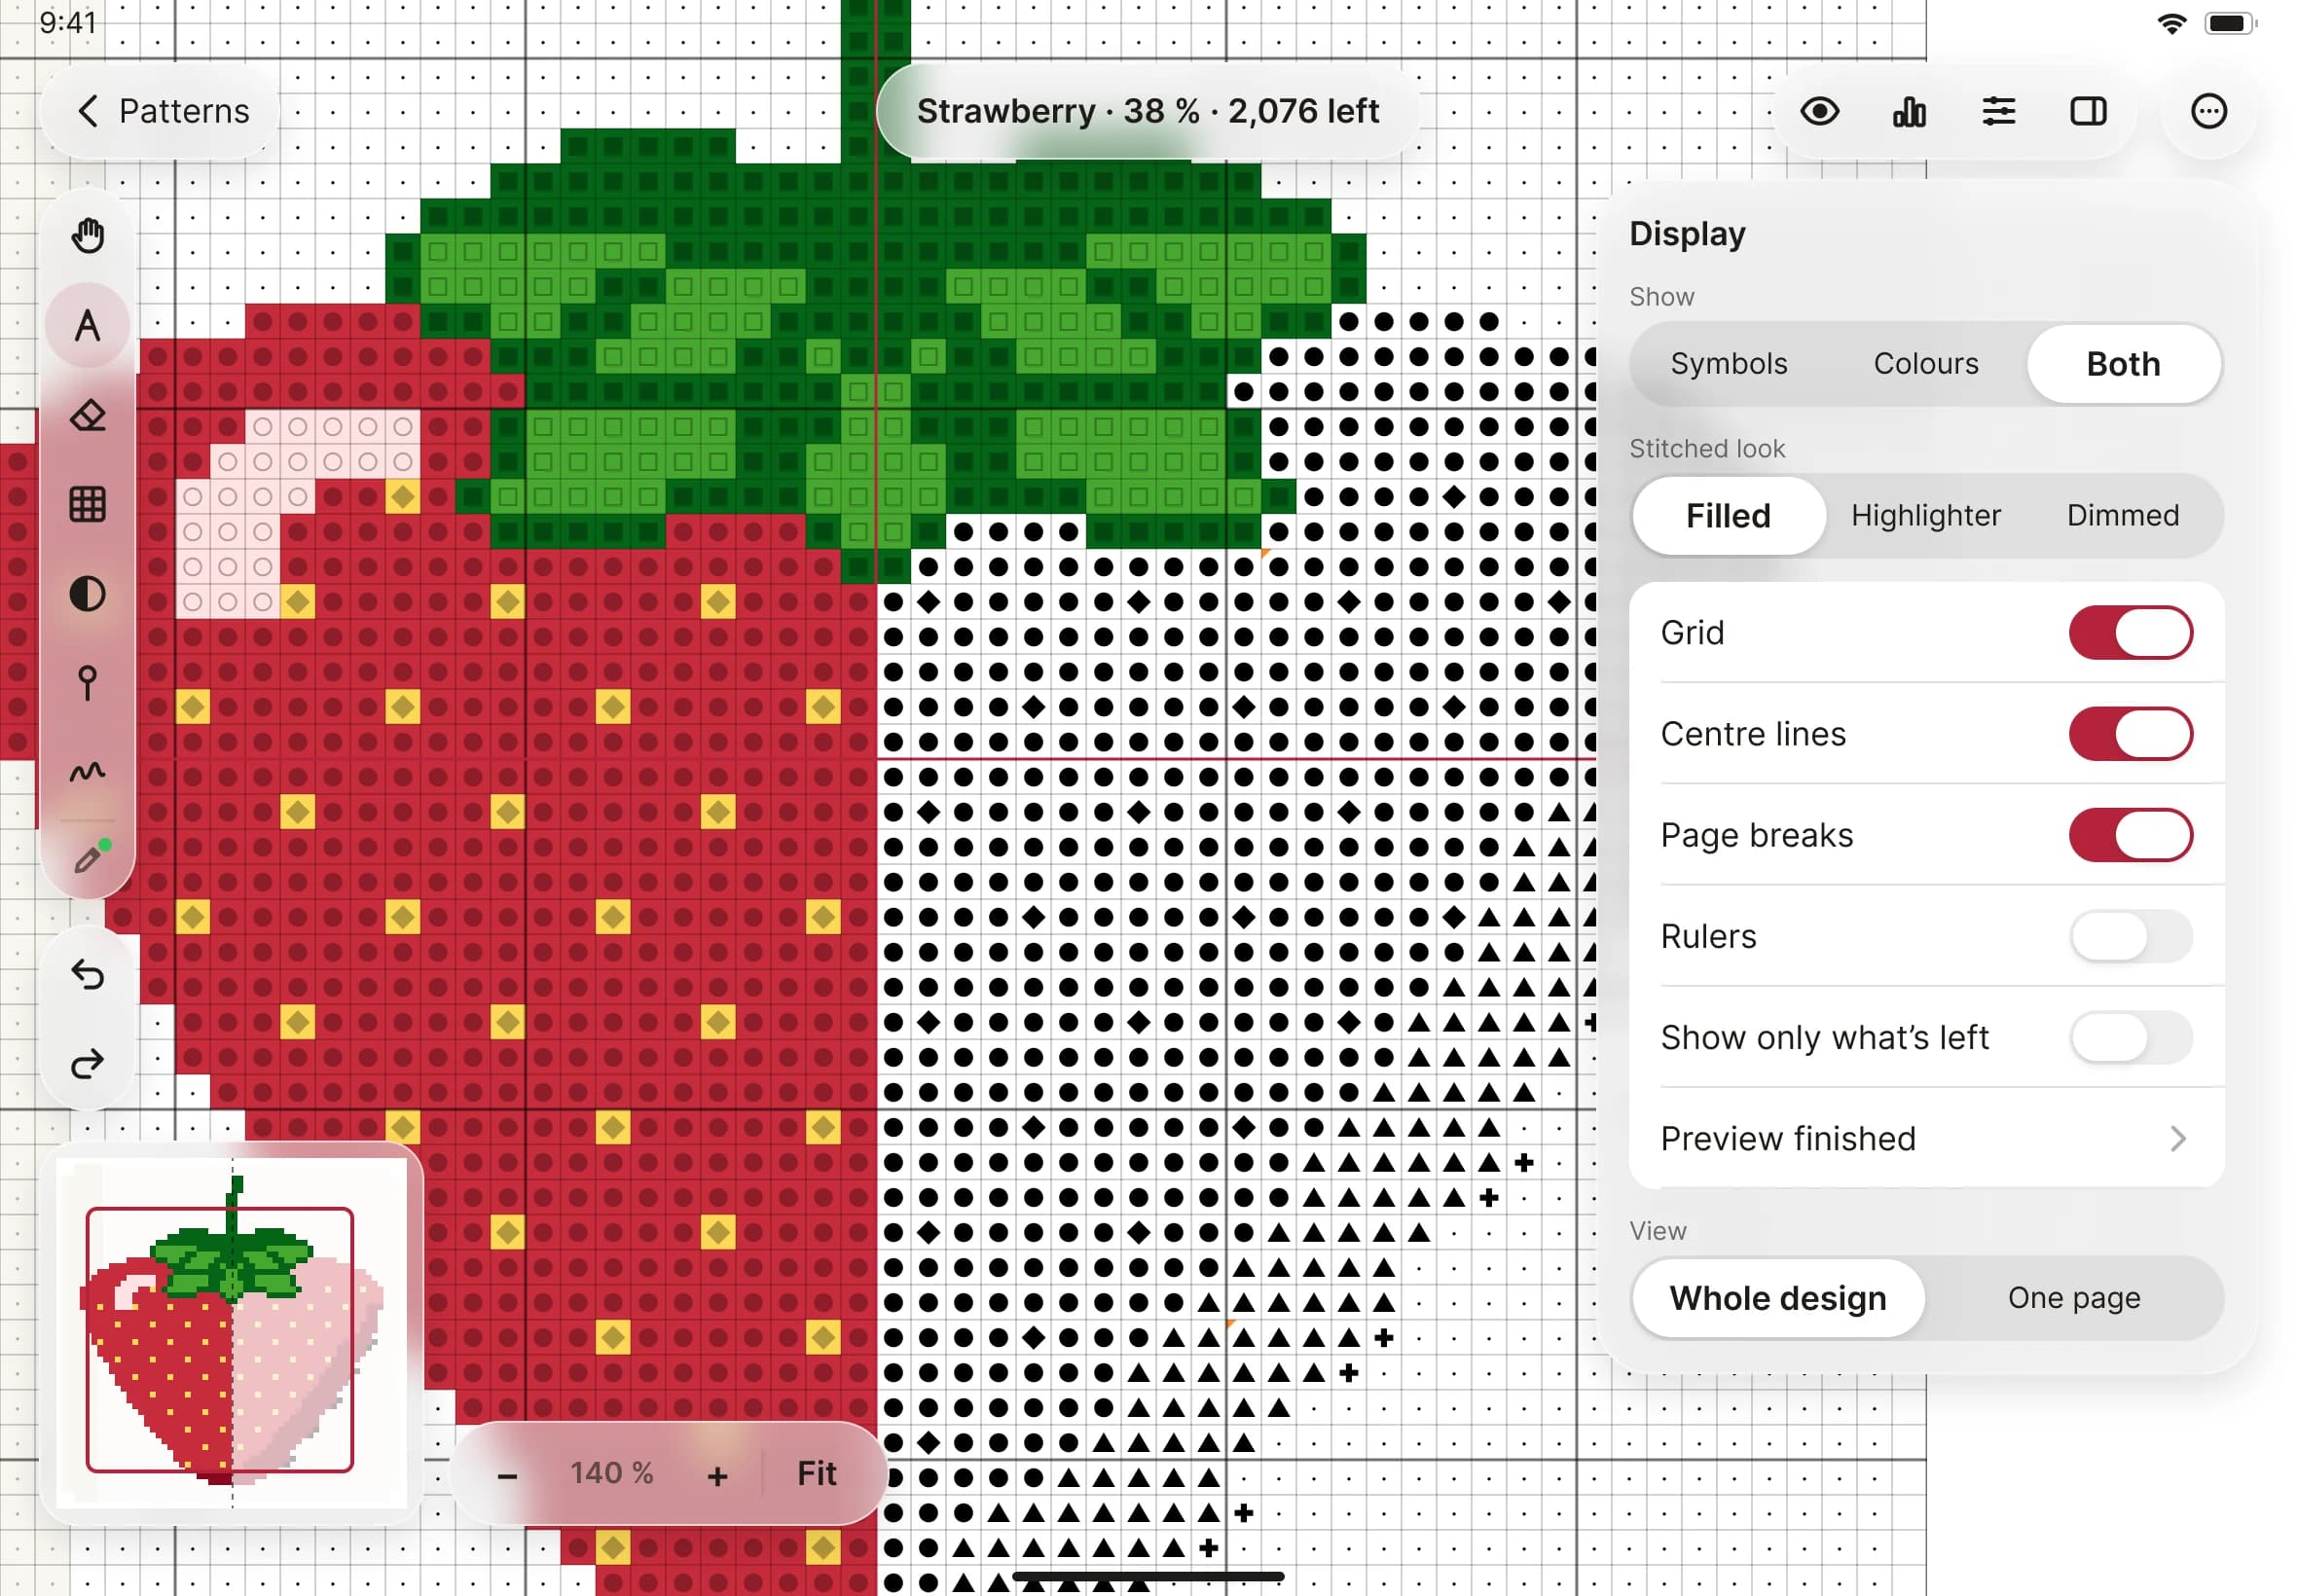
- On the stitching screen, tap the display button in the top right (the eye). A Display panel opens.
- Under Show, choose Symbols, Colours or Both.
- Under Stitched look, choose Filled, Highlighter or Dimmed. This is how a finished square looks.
- Switch the grid, centre lines, page breaks and rulers on or off. You can also choose Whole design or One page.
-
For settings that last, open Settings in the sidebar, then Chart display. Here you choose the grid and its line thickness, the centre lines, the page breaks, rulers, and guides at every 5 or every 10 lines.
-
Open Colours to choose your stitch mark colour and its strength, and the colour of each line and highlight on the chart. Each has a Default button.